Essential Linux Performance Observability Tools for Effective Debugging and Analysis

The Linux Operating System (OS) powers countless systems, from personal computers to massive data centers. When performance issues arise, understanding how to quickly and efficiently observe and analyze the system is critical to the customer experience. Linux offers a rich set of tools that provide users with the ability to observe and develop deep insights into its many complex layers. In this post, we’ll explore some of these tools, explaining what Linux performance observability means, why mastering these tools is essential for debugging in today’s ecosystem, and how Linux tools differ from those on other operating systems. We will also cover tools available at various layers of the Linux OS, from system libraries to hardware components.
What Linux Performance Observability Means
Performance observability refers to the ability to monitor and measure how a system behaves under different conditions, in a way that is meaningful to all relevant stakeholders. In Linux, this means tracking resource usage, latency, throughput, and errors across the entire stack. Observability is not just about collecting data but making sense of it to identify bottlenecks, inefficiencies, or failures.
Within Linux, performance observability covers multiple layers, such as:
System libraries: The integration point where applications interact with the operating system.
System call interface: The gateway for user-space programs to request kernel services.
Virtual File System (VFS): Abstracts file system operations.
Sockets and network layers: Manages communication protocols like TCP and UDP.
File systems and volume managers: Handles data storage and retrieval.
Block devices and network devices: Physical and virtual hardware components.
Scheduler and virtual memory: Manages the system load, balancing the execution of os processes and memory allocation.
Device drivers and hardware controllers: Interface with physical devices like disks and network cards.
Each layer has specific tools designed to provide visibility into its operations.
Why Understanding Linux Performance Tools Is Necessary for Debugging
When a Linux system slows down, crashes, or behaves unpredictably, pinpointing the cause can be challenging. This can be even more challenging in the event, performance degradations is impacting an external customer service and the ability to do business. Performance issues can also often span multiple layers, from hardware faults to software misconfigurations. Without access to the right tools, diagnosing these problems is guesswork and sometimes like operating blindly.
Using Linux observability tools helps you:
Identify bottlenecks: Find which component is limiting performance.
Analyze resource usage: Observe CPU, memory, disk, and network consumption metrics.
Trace system calls and events: See what processes are doing and the result of interactions in real time.
Monitor hardware health: Quickly detect failing devices or overloaded controllers.
Improve system tuning: Adjust parameters based on observed behavior.
For example, a slow file read might be due to disk I/O saturation, inefficient file system caching, or network delays if the file is remote. Observability tools help isolate the exact cause.
How Linux Observability Tools Differ from Other Operating Systems
Linux stands out for its openness and modularity. Unlike some proprietary systems, Linux exposes many internal metrics and events through interfaces like `/proc`, `/sys`, and eBPF (extended Berkeley Packet Filter). This openness allows a wide range of tools to access detailed, low-level data in a meaningful way.
Key differences include:
Rich command-line tools: Linux offers many built-in utilities like `top`, `iostat`, `strace`, and `perf` that provide immediate insights.
Extensive kernel tracing: Tools like `ftrace` and `bpftrace` allow tracing kernel functions and events with minimal overhead.
Customizable monitoring: Users can write custom probes using eBPF to capture exactly the data they need.
Layered architecture visibility: Linux tools cover everything from user-space libraries to hardware controllers.
Community-driven development: Many tools evolve rapidly with contributions of varying perspectives from developers worldwide.
Other operating systems may restrict access to kernel internals or require proprietary software for deep analysis. In sections to follow, we’ll use an Ubuntu VM, deployed using Multipass, to analyze and reference a few of the Linux tools. For more information on deploying VMs using Multipass, take a look at our earlier post, “Distributed Systems: Build a local Kubernetes Cluster with Multipass”.
Tools for System Libraries and System Call Interface
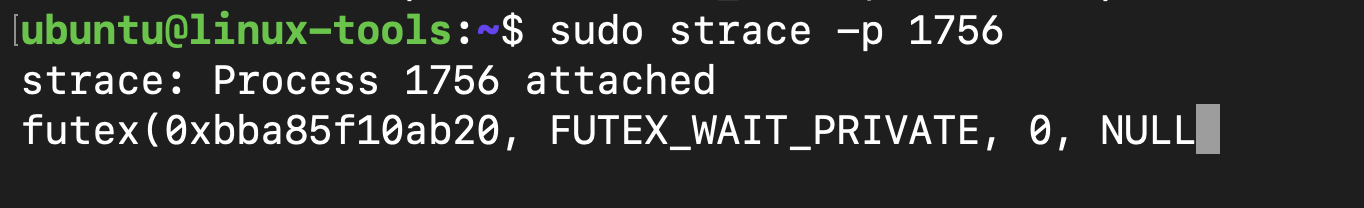
`strace`: Traces system calls made by a process. Useful for debugging application interactions with the kernel.
`ltrace`: Similar to `strace` but traces library calls.
`perf`: Profiles CPU usage and system calls, showing where time is spent.
Example: Use `strace` to see if a program is stuck waiting on a file read or network call.
Tools for Virtual File System (VFS) and File Systems
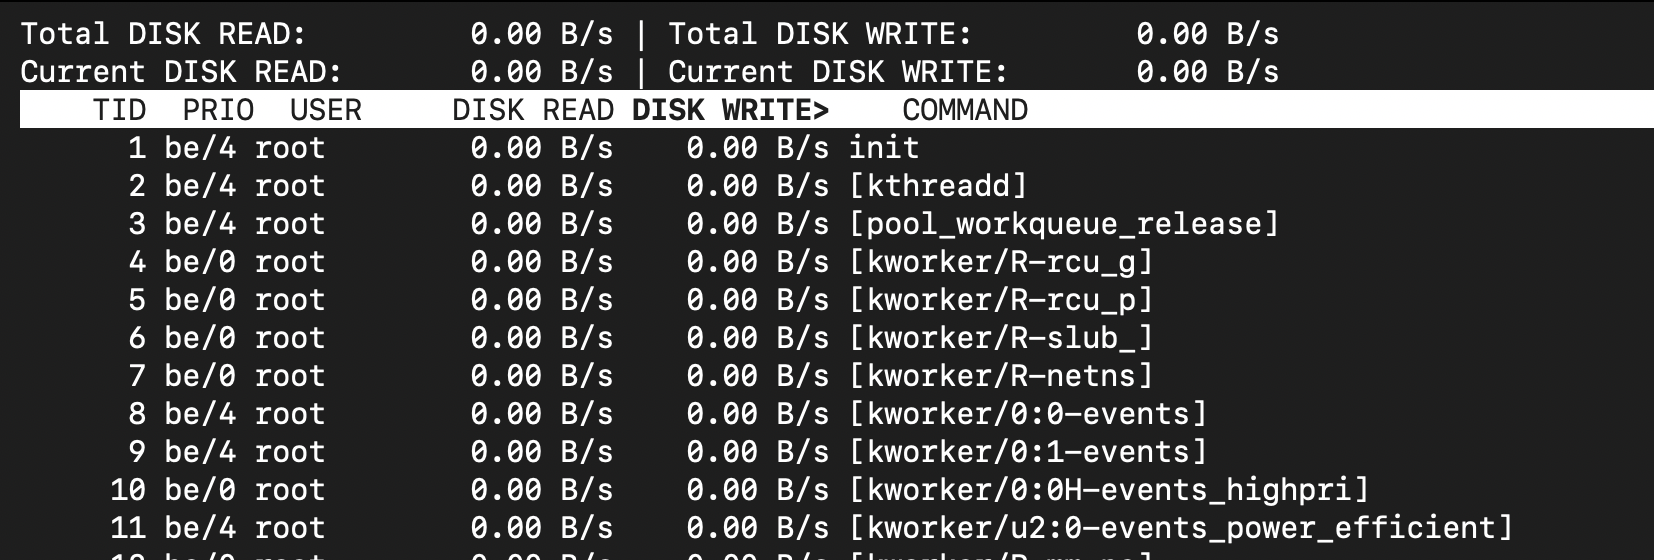
`iotop`: Monitors disk I/O usage by processes.
`blktrace`: Traces block I/O operations at the kernel level.
`dstat`: Provides real-time statistics on disk, network, CPU, and memory.
Example: Use `iotop` to find processes causing heavy disk writes. Due to a security issue, (CVE-2011-2494), leaking sensitive data across user boundaries, iotop now relies on root priviledges or the NET_ADMIN capability.
Tools for Sockets, UDP/TCP, and Network Layers
`ss`: Displays socket statistics and connections.
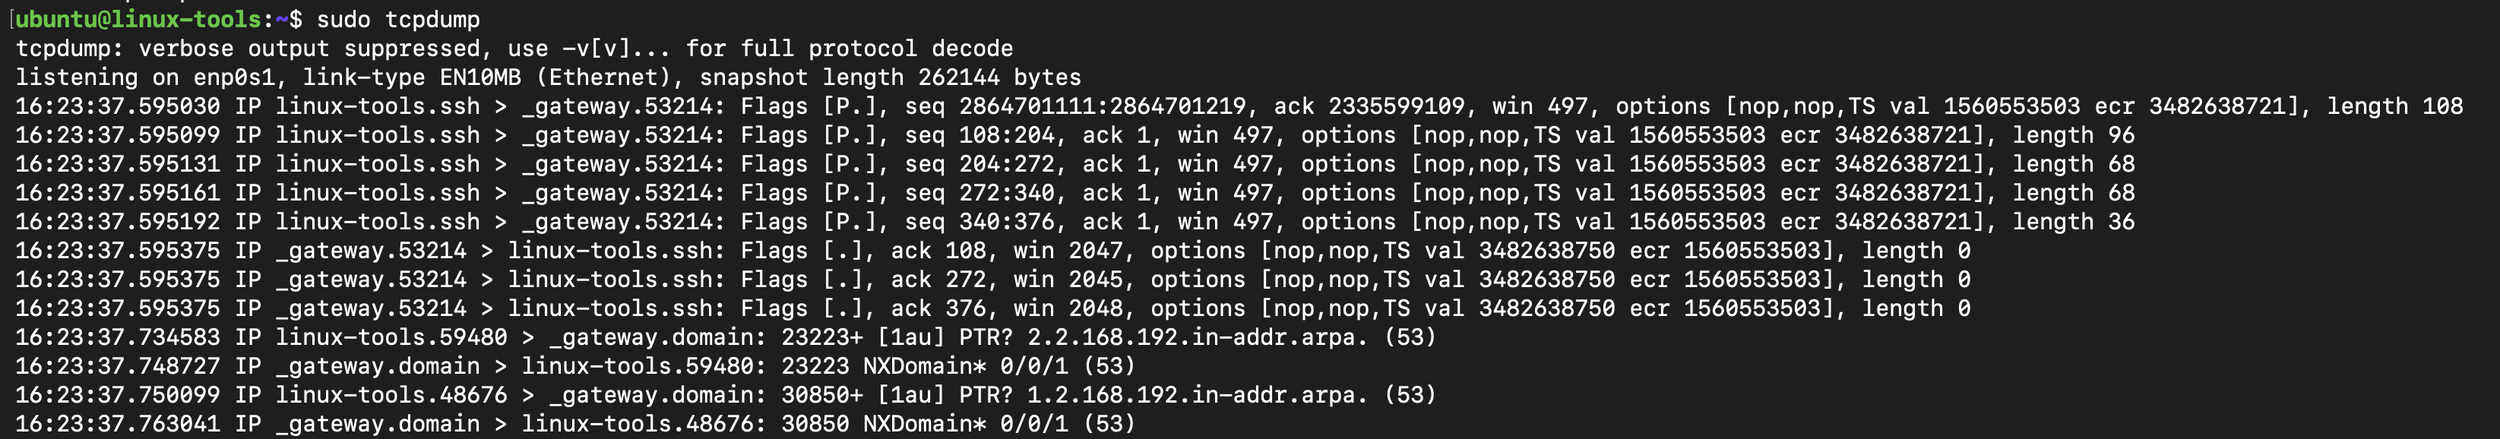
`tcpdump`: Captures network packets for analysis.
`ip`: Manages and displays IP routing, devices, and tunnels.
`nethogs`: Shows network bandwidth used by processes.
Example: Use `tcpdump` during debug sessions to quickly analyze packets and resolve issues.
Tools for Volume Manager and Block Devices
`lsblk`: Lists block devices and their mount points.
`dmsetup`: Manages device mapper devices, including LVM volumes.
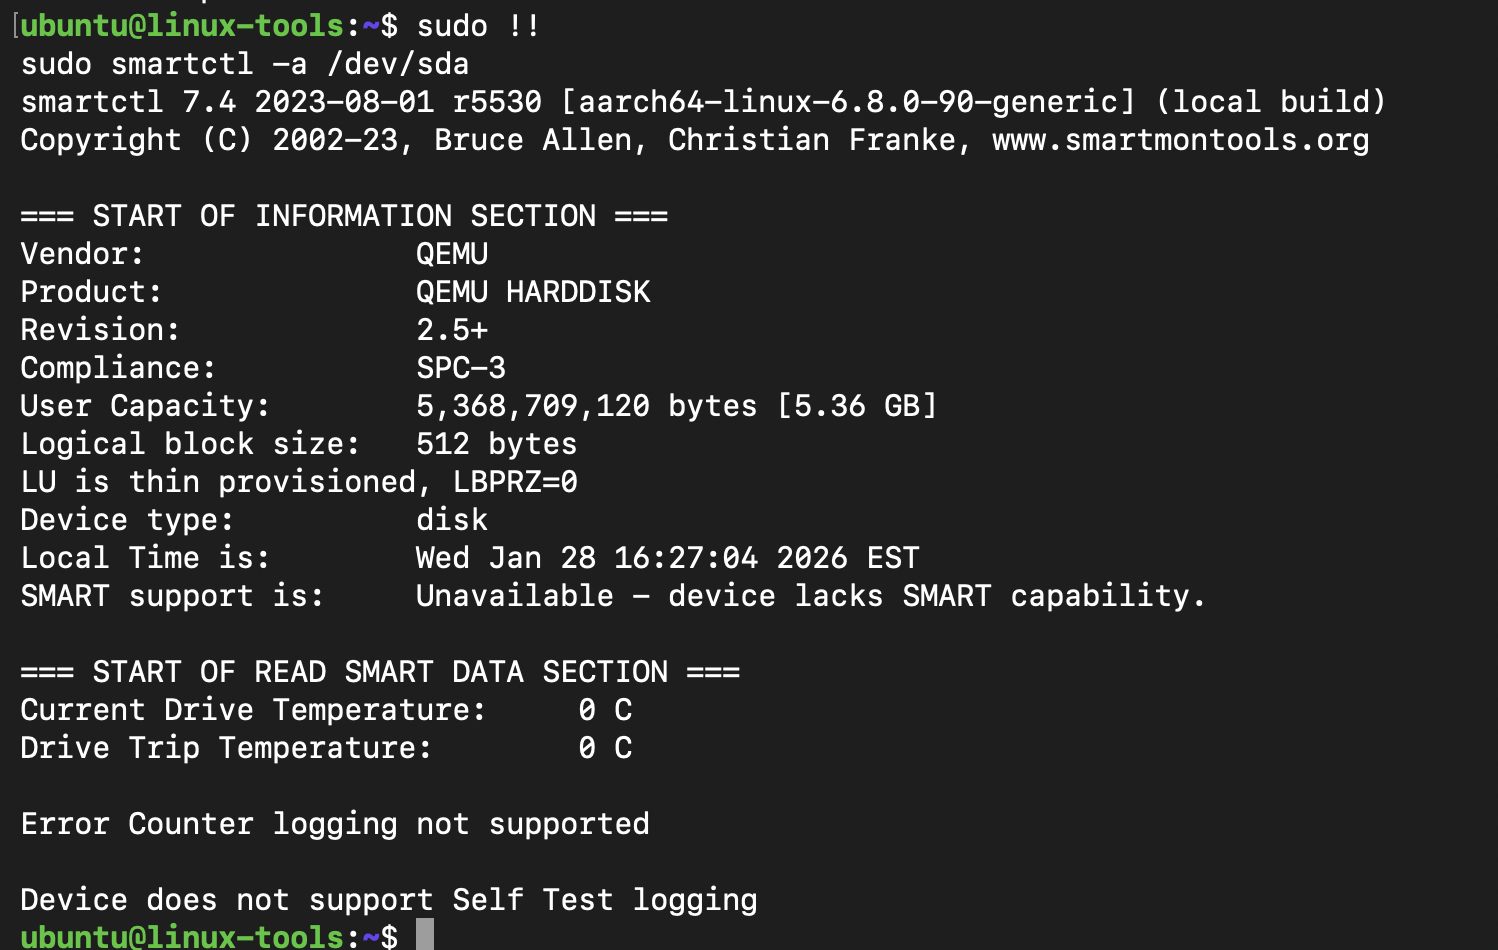
`smartctl`: Checks health status of storage devices using SMART.
Example: Use `smartctl -a /dev/sda` to check disk health. You’ll need to first install the smartmontools to run this command!
Tools for Network Devices and Controllers
`ethtool`: Queries and controls network device settings.
`ifstat`: Monitors network interface bandwidth.
`bpftrace`: Can trace network events at the kernel level.
Example: Use `ethtool eth0` to check link speed and errors. In this Ubuntu instance, eth0 network interface is not configured. Use ip link show to list network interfaces and use the appropriate interface within the command to analyze output.
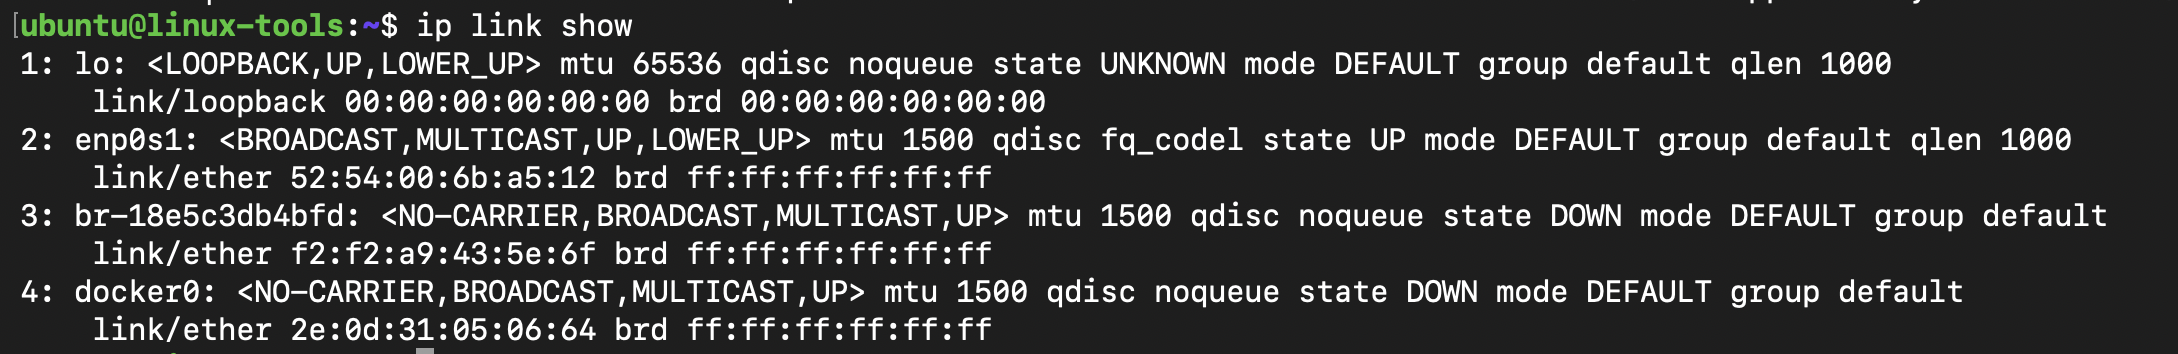
ip link show command used to display network interfaces to pass to the ethtools command.
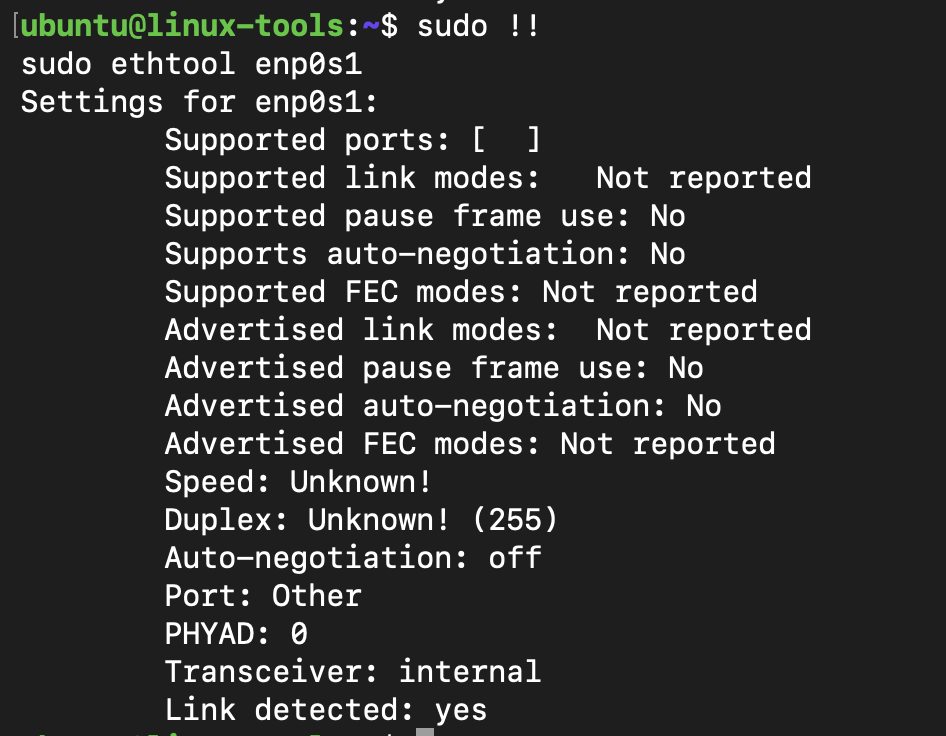
ethtool output for enp0s1 network interface. Not much to see on a newly configured ubuntu multipass environment.
Tools for Scheduler and CPU Monitoring
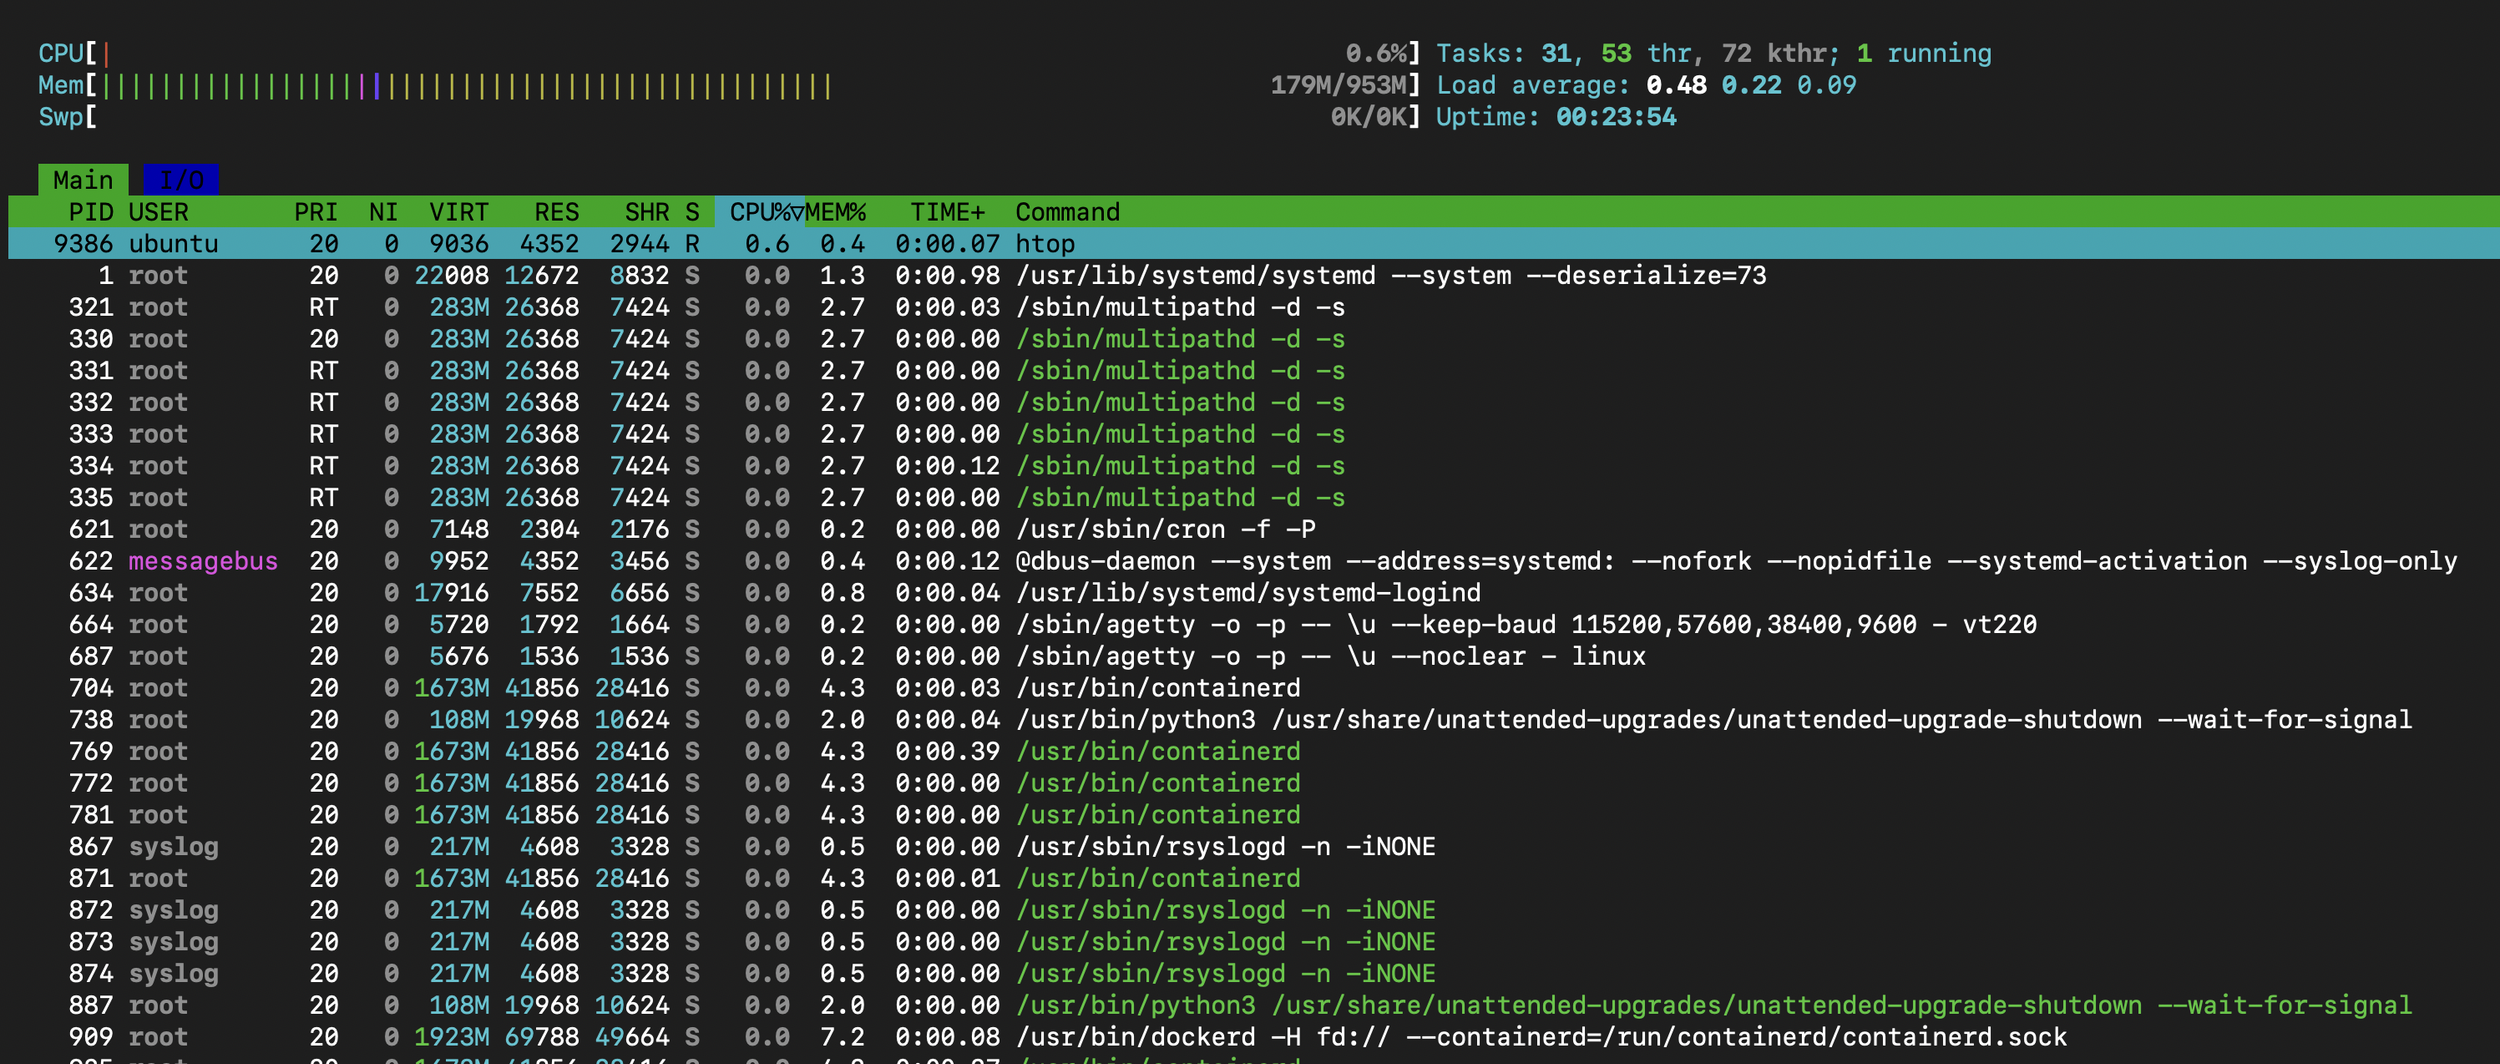
`top` and `htop`: Show CPU usage per process.
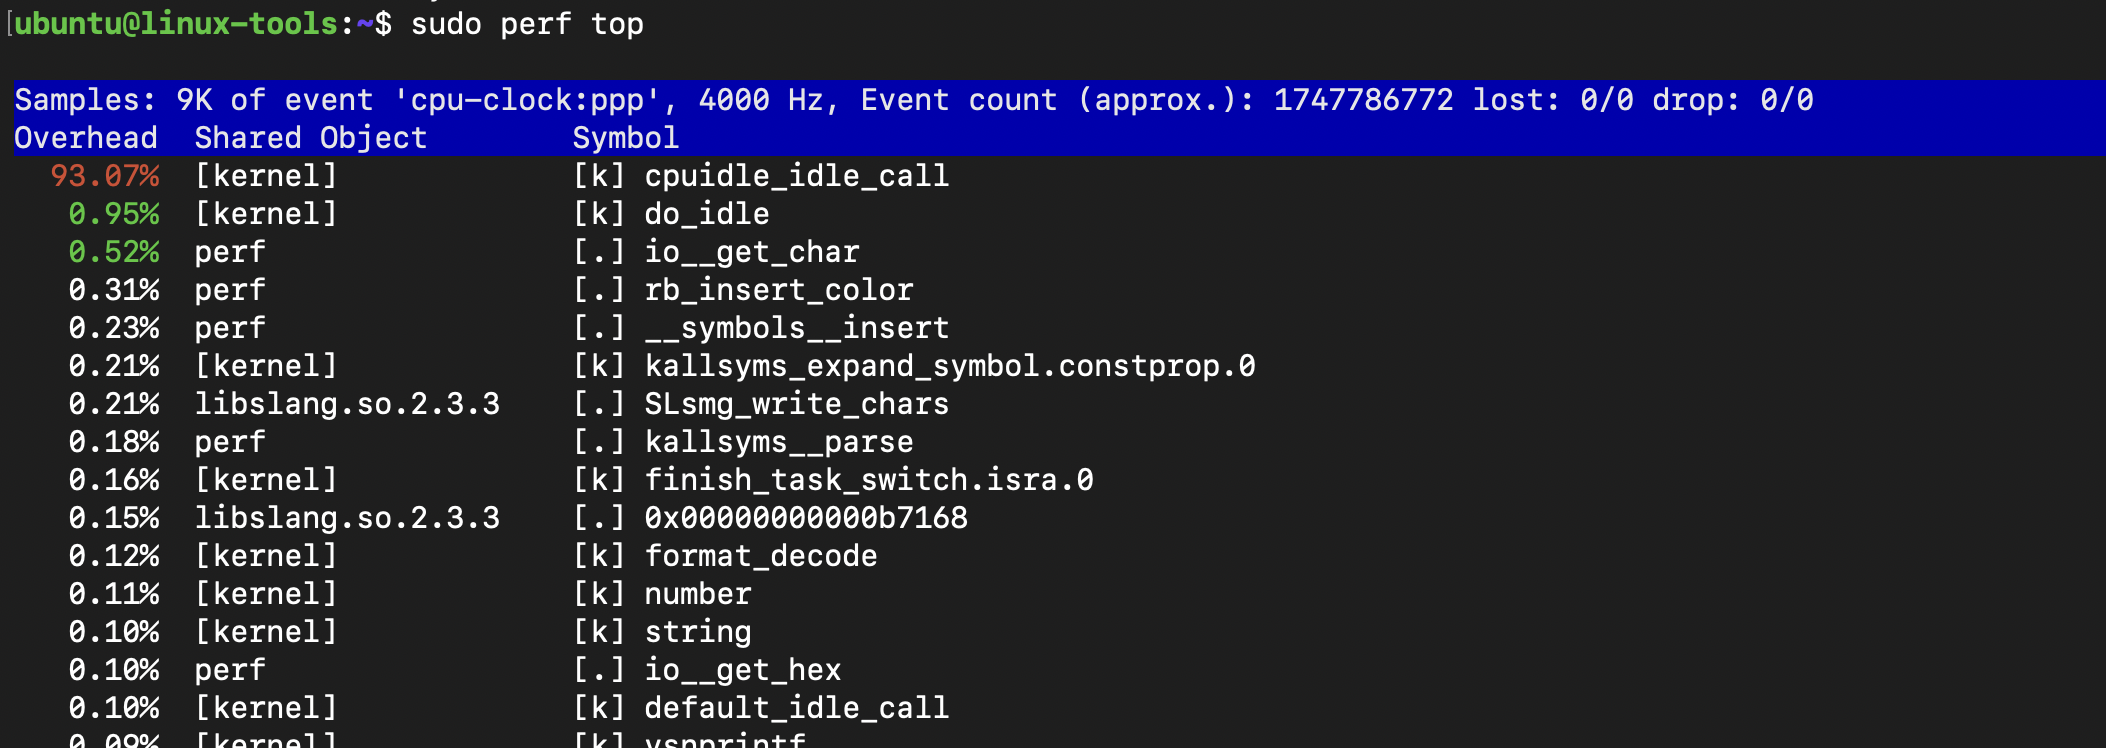
`perf`: Profiles CPU performance counters.
`pidstat`: Reports statistics for individual processes.
Example: Use `perf top` to see which functions consume CPU cycles.
Example: Use `htop` to check a processes CPU usage. However, htop differs in that its output is more interactive and includes a more monitoring details with a richer view.
Tools for Virtual Memory and DRAM
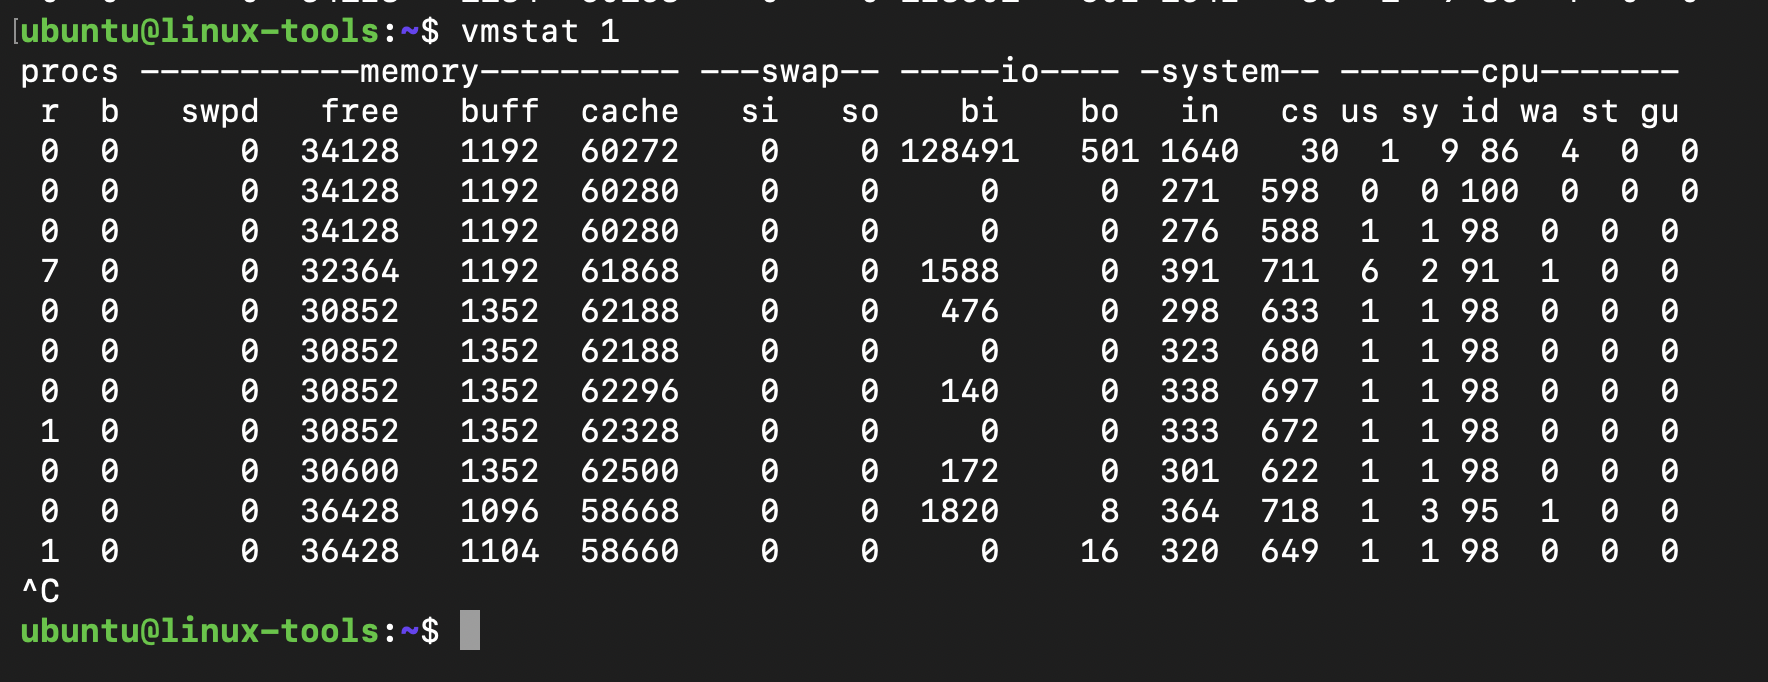
`vmstat`: Reports virtual memory statistics.
`free`: Displays memory usage.
`slabtop`: Shows kernel slab cache usage.
Example: Use `vmstat 1` to monitor memory and swap activity every second.
Tools for I/O Bridge and Controllers
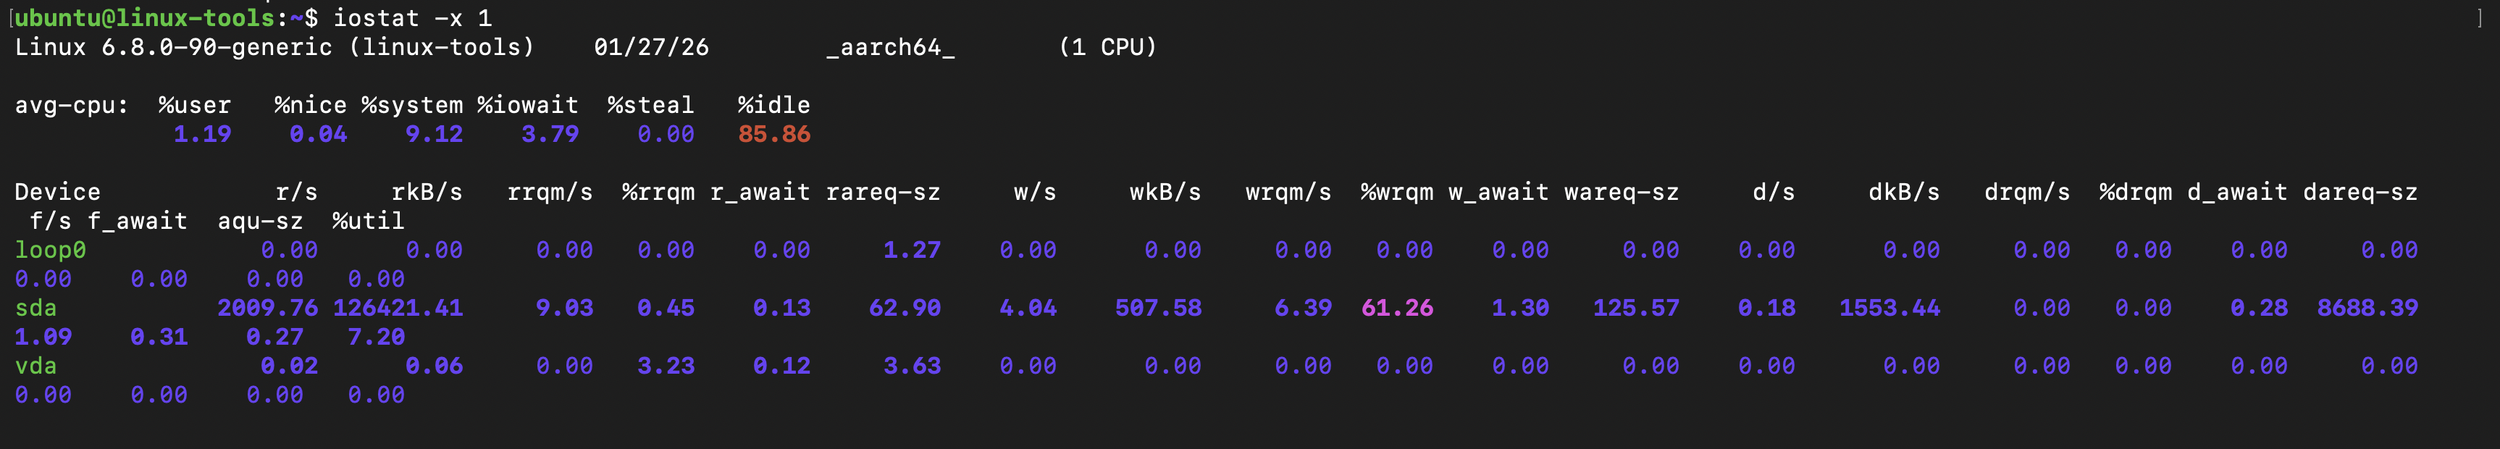
`iostat`: Reports CPU and I/O statistics for devices.
`dmesg`: Displays kernel messages, useful for hardware errors.
`lspci`: Lists PCI devices including I/O controllers.
Example: Use `iostat -x 1` to monitor detailed I/O stats per device.
Practical Example: Diagnosing a Slow System
Imagine a Linux server experiencing slow response times. Using observability tools, you might:
Run `top` to check CPU load.
Use `iotop` to see if disk I/O is high.
Check network with `ss` and `nethogs` for unusual traffic.
Inspect system calls with `strace` on a slow process.
Review kernel logs with `dmesg` for hardware errors.
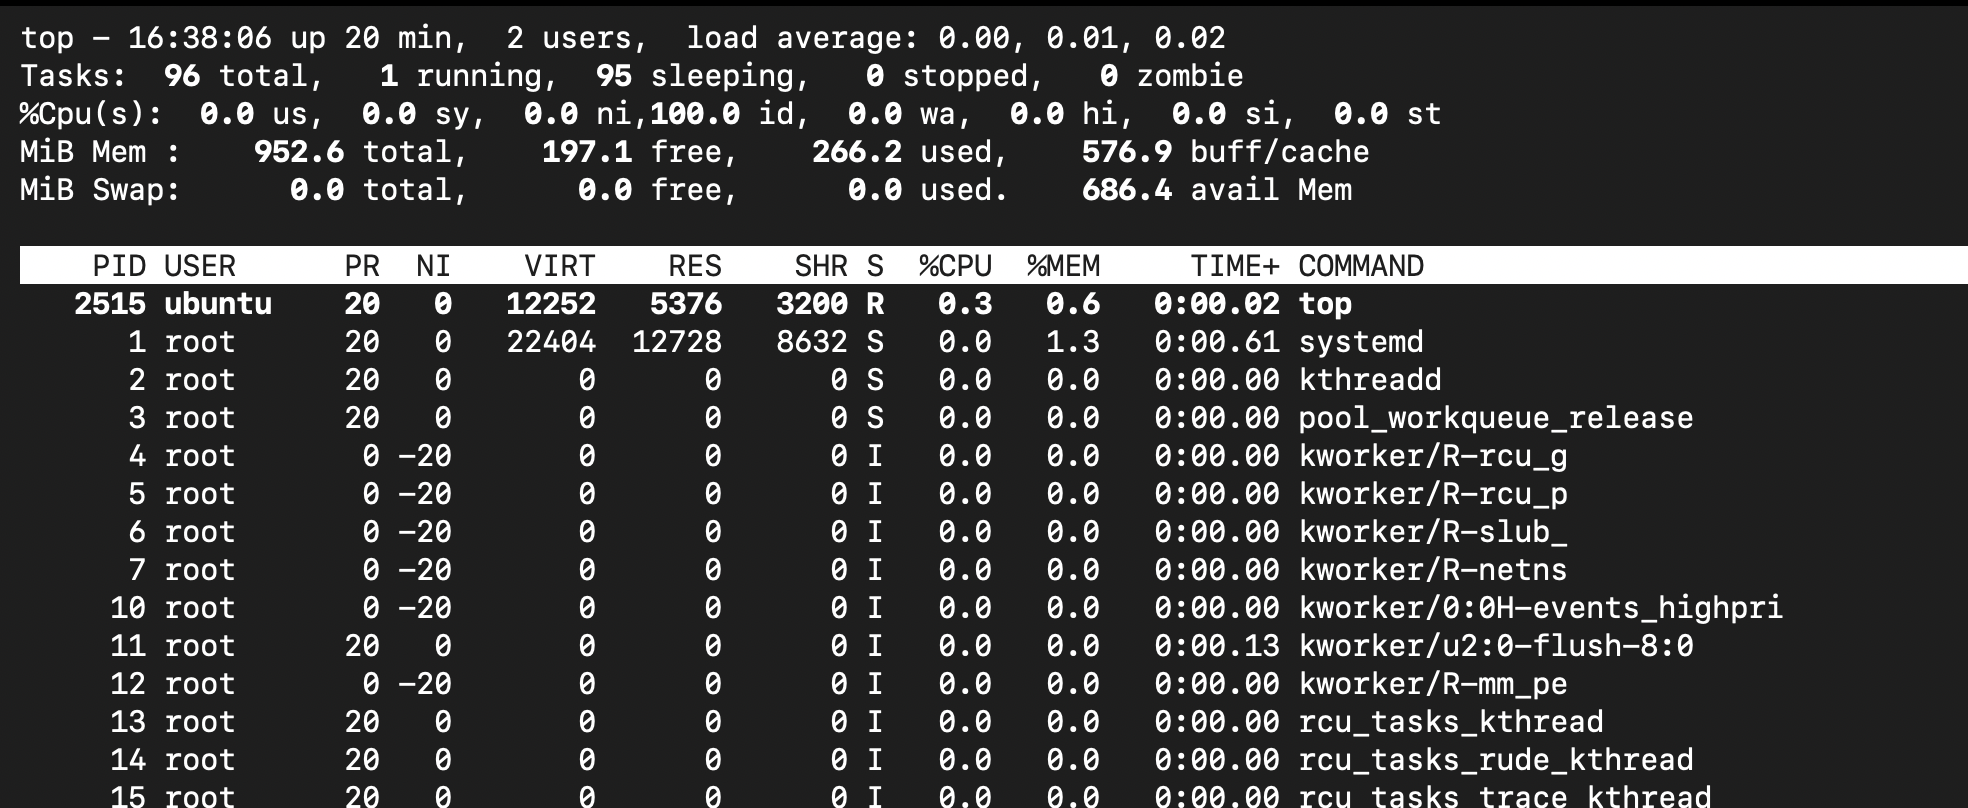
top command to review CPU workloads or consumption.
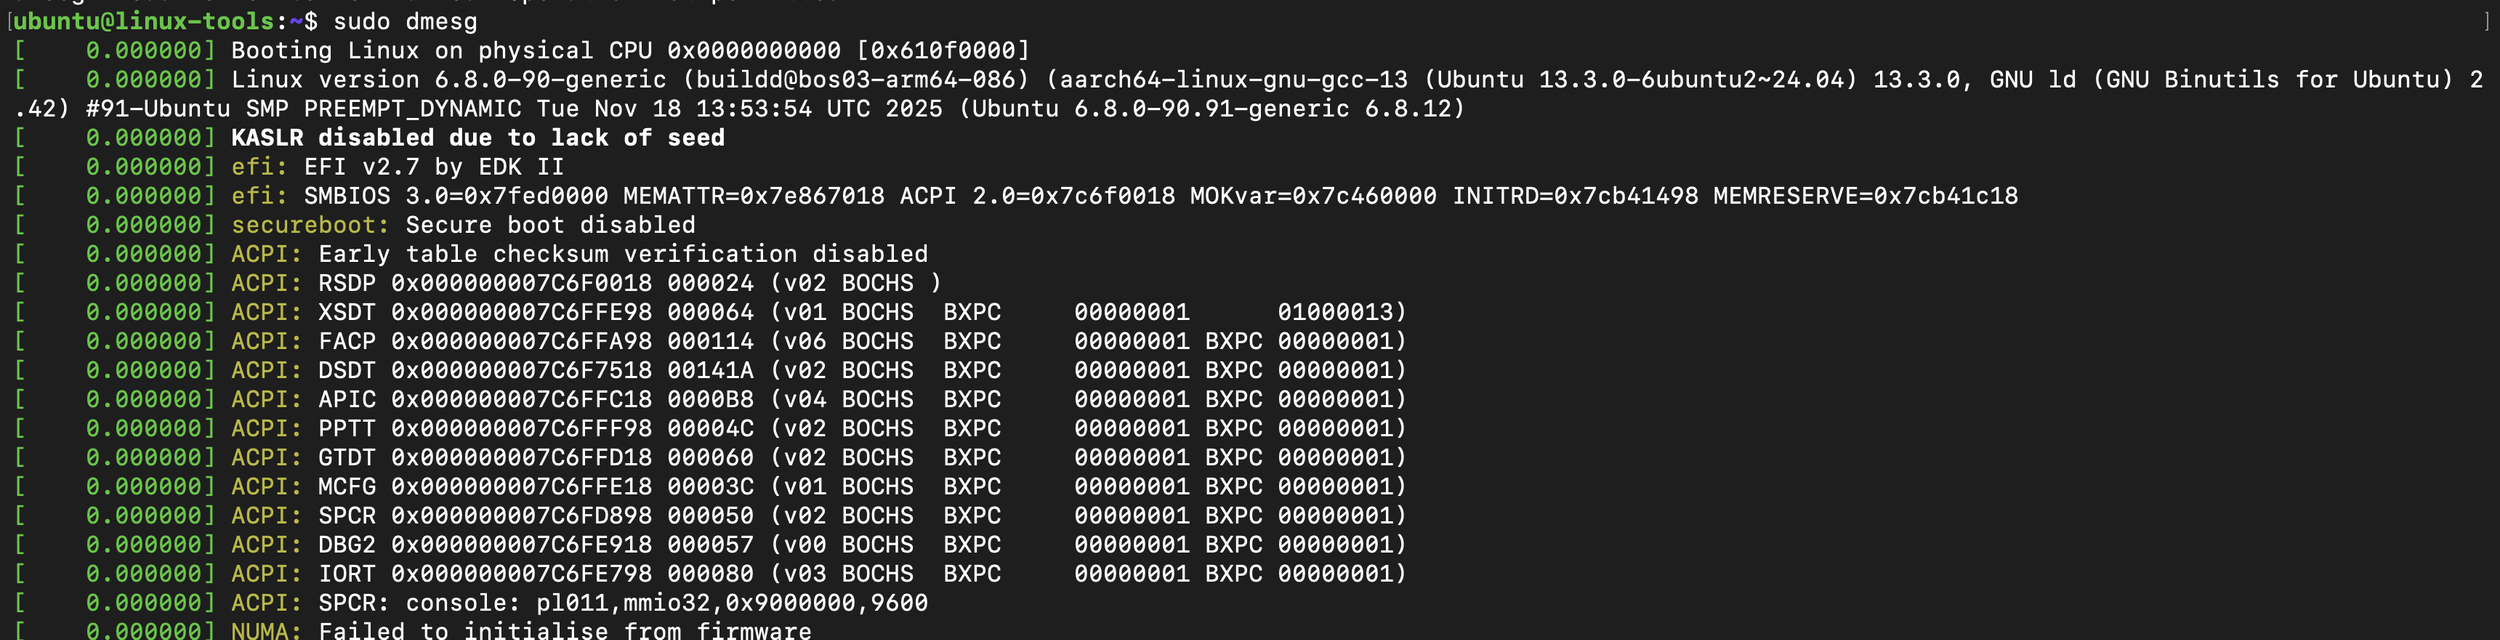
dmesg output used to check for relevant errors for their respective components or underlying hardware.
This layered approach will help you to pinpoint whether there is an issue with CPU saturation, disk bottleneck, network congestion, or software bugs.
Mastering Linux performance observability tools, is not an overnight task, but it will encourage you to maintain system health and quickly resolve issues. Each tool offers a window into a specific layer of the Linux stack, and together they provide a comprehensive view. Start by exploring tools relevant to your environment and gradually build expertise across layers. It’s important to also note, all tools are not automatically installed on every Linux distribution. In these instances, its even more important to ensure familiarity with diagnostic tooling, to proactively install or hightlight awareness and install during debug sessions.